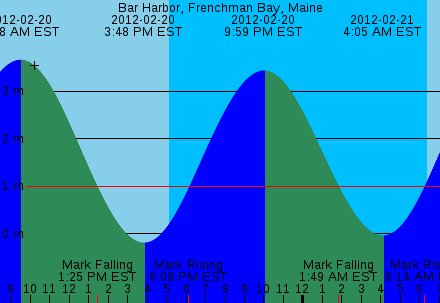
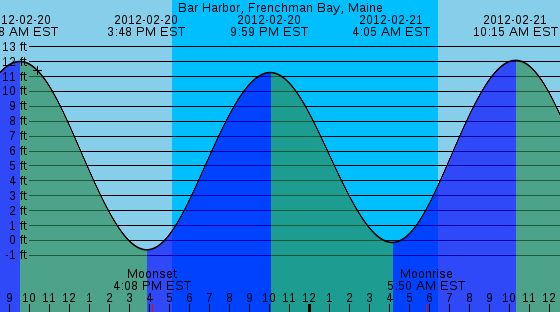
The "mark level" is a specific tidal height or current velocity of your choosing. When you set a mark level for a location, the times at which the tide level crosses the mark level will be displayed at the bottom of graphs and included in plain listings and calendars. This option is useful to determine the times when the tide will be low enough to expose something that is submerged at high tide or high enough to provide a desired depth. You can set a mark level by selecting the Set Mark option on the Options menu. In the following example, a mark level of 1 m has been applied to Bar Harbor predictions to find the approximate times at which one can walk to Bar Island without getting one's feet wet.
Mark level crossings are not displayed in clock mode windows due to lack of space.
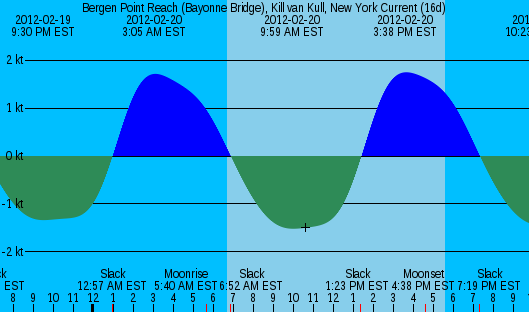
The "aspect" is a number that controls how stretched out or scrunched up a graph is. If timestamps are overlapping one another on a tide graph and becoming unreadable, you can increase the aspect to make them farther apart. An aspect of 1.0 is "normal;" an aspect of 2.0 stretches the graph by a factor of 2; an aspect of 0.5 does the opposite, compressing the graph. You can change the aspect by selecting the Set Aspect option on the Options menu.
In raw and medium rare modes, tide levels are normally listed with an increment of one hour for successive lines of output. You can adjust this increment using the Set Step option.
The control panel is the easiest way to customize the many user-serviceable settings of XTide. It is available from the options menu of prediction windows.
It's not pretty, but it gets the job done. The many individual settings have their many individual dialogs, and all are simply thrown together into a resizable window in no particular order. Resize and scroll as needed.
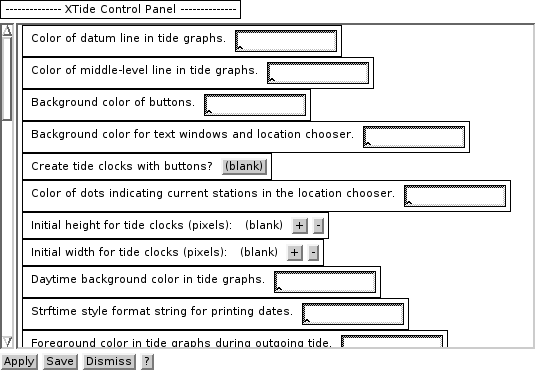
Colors can be changed to any of the "standard" X-windows color names or to 24-bit RGB specifications of the form rgb:hh/hh/hh by typing the new colors in the dialog boxes. Fonts must be specified in fontconfig format (e.g., "Helvetica-10") if XTide was built with Xaw3dXft, or in traditional XLFD (e.g., "-*-helvetica-*-r-*-*-10-*-*-*-*-*-*-*") if not. Other settings have pull-down choice menus or counting buttons to help you along. Least user-friendly, but most powerful, are the timestamp formats. In return for reading the Unix man page for the strftime library function, you are empowered to change the timestamp formats to practically anything you could ever need.
You can choose Apply to see how the settings look in the current session only, or Save to make the settings permanent. They will be saved in the file ~/.xtide.xml. N.B., font changes require a restart to become effective.
Graphstyle l (line):
Graphstyle s (semitransparent) with line width set to 1.5:
Note that semitransparent style makes no sense in formats that don't support opacity (text and PseudoColor X-windows).
Original graph with crowded caption line:

With aspect 1.5 (to stretch out the graph):
With time format "%H:%M" (to eliminate AM/PM and time zone verbiage):
With event mask "Mm" (to filter out moonrise and moonset events):
With graph font changed to LiberationSansNarrow-10:
This station has such a small tidal range that the only label on the depth axis is zero meters, which is kind of useless:
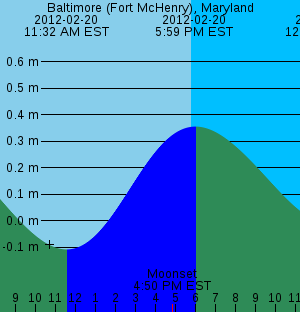
With option to label tenths of units enabled:
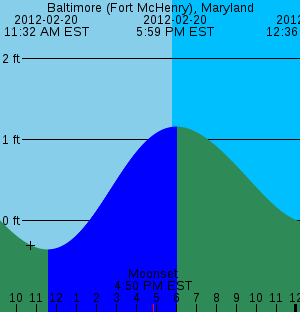
With preferred units set to feet:
The interactive client supports all of the command line switches related to settings which are described in a later section. In addition, it supports the following.
If you use the same location a lot, you can set the environment variable XTIDE_DEFAULT_LOCATION to its name instead of using -l every time.
Other switches that are supported by the non-interactive interface are not supported by the interactive interface and will be ignored.
The arguments to -display, -fn, and -geometry cannot be concatenated with the switches (see Quirk #5).